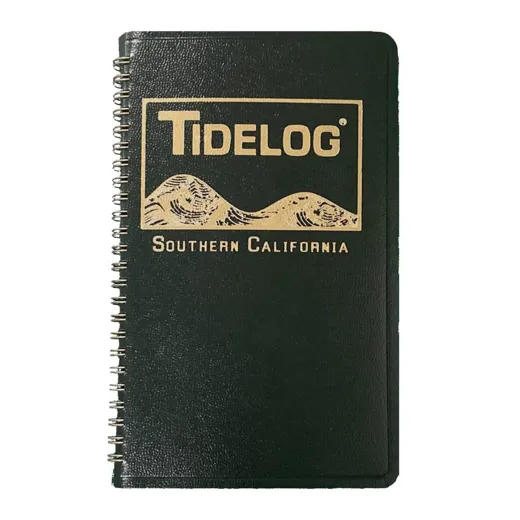
Southern California 2027
Description
Includes Los Angeles, San Diego and the Gulf of California; North to Monterey and south to Manzanillo, Mexico.
Daily Tidelog Graphics are based on NOAA predictions for Los Angeles, showing times and heights for Los Angeles and San Diego. The time and strength of maximum currents, as well as times of slack water, are displayed daily at the San Diego Bay Entrance. Tide tables for Port San Luis are included at the back of the Tidelog.
| Location | Key Data |
|---|---|
| Los Angeles | NOAA-predicted tide times and heights |
| San Diego | NOAA-predicted tide times and heights |
| San Diego Bay Entrance | Maximum current strength, slack water times |
| Port San Luis | Tide tables |
FAQ
What areas does the Tidelog 2027 cover?
The Tidelog 2027 covers Southern California, including Los Angeles, San Diego, and the Gulf of California, from North to Monterey and south to Manzanillo, Mexico.
Are the tide predictions based on real data?
Yes, daily tide predictions are based on NOAA forecasts for Los Angeles and San Diego.
Is there information on currents and slack water?
Yes, the Tidelog includes daily data on the time and strength of maximum currents and slack water times at the San Diego Bay Entrance.



Stephanie Morgan –
This tide log is very useful for planning boat trips. The daily graphics for Los Angeles and San Diego are clear and easy to read. I use it regularly when fishing near the bay entrance and it helps me avoid strong currents.
Justin Hudson –
The inclusion of Port San Luis tide tables is a nice addition. I found the current data at San Diego Bay Entrance very helpful for timing my boat movements.
Adam Knox –
Accurate and reliable. The NOAA-based predictions match what I observe in the field. Great for both recreational and commercial boating in the region.